This a modified transcription, to provide clarity, of a talk I gave at the San Diego Google offices. Full disclosure, we are a very satisfied Google cloud customer and I was supplied with ample craft beers to give this talk. Original video.
Who Is Zesty.io
We are a Software as a Service(SaaS) company that provides a web content management system (WCMS) for our customers. What that means is we make delivering enterprise grade websites and content easy. Our platform provides scale, security, and a CMS your marketing team won’t hate out of the box. This empowers our customers to improve their end users web experience, make their marketing team happy, and free up their development team to be more agile and focus on delivering experiences. All the while staying compliant with their departments.
Today, I’m going to share insights into how we deliver on the scale and stability of our platform. I’ll start with going over how we got to our current infrastructure and I’ll share some ways we’ve been using Stackdriver. Finally, I’ll cover the value it has provided our business and customers.
First, to provide context into the level of traffic we service at Zesty.io. Within the last 30 days, our platform serviced close to half a billion requests. That equates to approximately 72 terabytes of data. We have had significant increases year after year.

A Few Acronyms
Things We Needed To Solve For
We have three primary concerns with our platform infrastructure. It wasn’t to long ago that all of these had to be solved in house by our engineering team.
- Hardware Upgrades
- Server/Software Patches
- Server Outages
Hardware Upgrades
This generally is the situation of “...we have a lot more customers now, our server resources are maxed out, how do we scale this…”. Traditionally, you would have had a server maintenance window. There would be a physical hardware upgrade. Obviously, this was a very fragile process with a lot of concerns and things that can go wrong.
Server/Software Patches
This is when you upgrade the Operating System software or the software your services depend upon. Once again there are a lot of concerns. “Will this break things immediately? Will this break things later, after I’ve updated the software? How do I figure out the update was the problem?”
Server Outages
How do you know when your services are unavailable? Hopefully, you know before your customers are telling you. If they are unavailable, how do you recover?
How We Arrived At Our Current Platform Infrastructure
First came IaaS
Infrastructure as a service takes away a lot of the pain of running services. Specifically, it solves hardware upgrades. Now, when you want to upgrade your servers there is no downtime. It’s typically the push of a button or slide of scale and in a few minutes you can provision new, more powerful, hardware, allowing for vertical scaling of your resources.
Zesty.io originally ran within Rackspace, our infrastructure provider. They provided us servers we could scale with a UI, but we still managed upgrading software and ensuring they were alive and healthy.
Then Came PaaS
This is when both the hardware and underlying operating system your application run on is handled for you, allowing for your software to be horizontally scalable by adding new instances with the click of a button. Once we decided to move out of Rackspace, we began evaluating what the next evolution of the platform would be. Initially we considered AWS and deploying our services with “Golden” server images via CI/CD tools. To this point of we built a CI/CD tool, I would highly recommend you do not build a CI/CD tool. At this point in time, PaaS wasn’t quite a proven delivery or business model. Heroku was the primary option, but it was cost prohibitive with the amount of traffic we serviced. Eventually we settled on running Docker containers in a Kubernetes cluster on GCP. Essentially, Kubernetes provides the tooling to run your own patchable and scalable platform without a service provider. We selected GCP over AWS as our vendor due to Google's experience delivering services with Kubernetes; in addition, at the time AWS Kubernetes support was not great.
Lastely We Added MaaS
This handles our final concern of how do we know our services our running health. You’ve probably heard of products like Pingdom who ensure this for you. Monitoring as a service typically works by making HTTP requests to your services and sends an alert if they do not respond within a certain defined time frame.
Although we had Pingdom and log ingestion in place, we were not capturing metrics on our system. We considered setting up a Prometheus.io server and instrumenting our code to collect metrics. I’m glad we did not. As we found out Stackdriver can provide virtual machine and networking metrics out of the box. Plus! I’m pretty sure Stackdriver uses Prometheus.
With GCP and specifically GKE/GCE we solve two of our primary concerns. For our third concern, we were able to significantly improve this by taking of advantage of Stackdriver and the integrations it has with GCP. Stackdriver gives us quite a few things out of the box; metrics, policies & alerts, uptime checks and graphs.
Metrics are arguably the biggest value provided by Stackdriver on day one at no organizational cost. Meaning there is no need to hire someone to accomplish this and no development work is needed before you get this value.
Alerts give us good insight into when our platform is exceeding its standard usage allowing for predictions of outages and circumventing them before they occur. It also allows for immediate response times from our engineering team when incidents do occur.
Uptime Checks allow for checks against our platform and core services as well as checks against customers and their services. Essentially anything available via HTTP is checkable.
Graphs allow us to explore our data and discover areas which need investigation. They also allow us to view our data overtime and discover trends. Whether those trends are positive or negative.
A Practical Example Of How We Use Stackdriver
CPU Usage Alerting

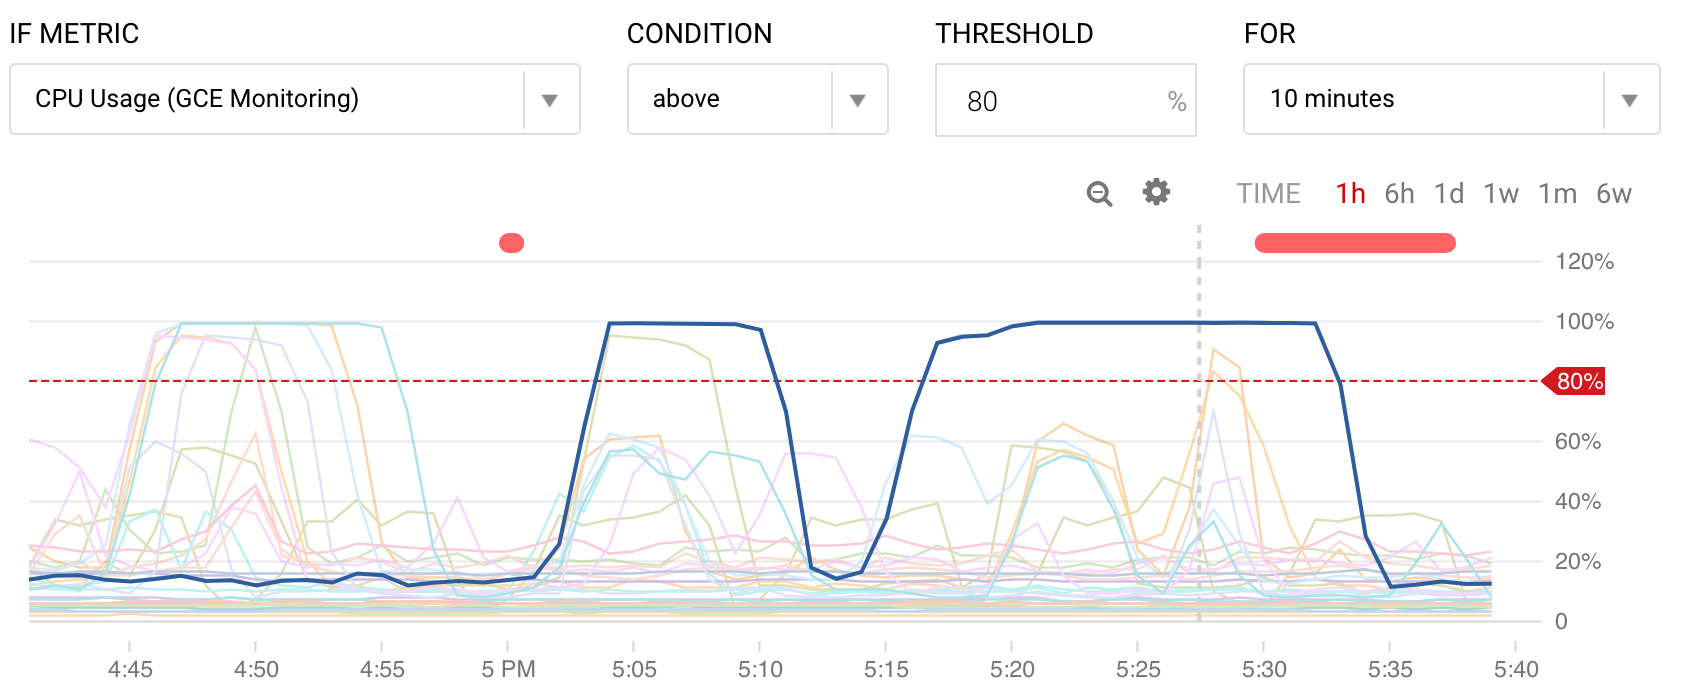
This is an alert we setup for our containers CPU usage if it exceeds 80% consumption for more than 10 minutes. I would not encourage you to set this up as an alert for a production environment, you will make your engineers very mad and tired. We drove ourselves a little crazy for a few days while we debugged some of our services with this alert but it was very helpful in discovering an issue we will look into deeper.
Uptime Checks & Latency

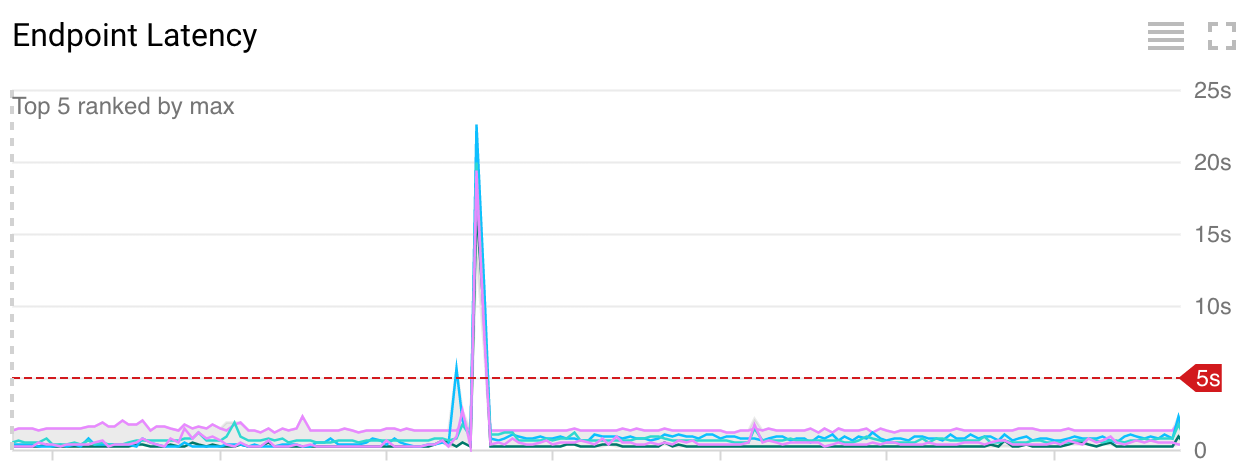
By adding uptime checks across all available regions for key customers and product endpoints, we were able to gain insight into our global latency performance. As you can see in this graph, we have a large spike in latency. I assure you it’s not as bad as it looks. What it allowed us to do was to investigate and determine it was a single uptime check location that was experiencing latency. Which typically indicates there is an issue with the check at that point in time and not the platform. Out of the box I can monitor multiple uptime checks and have an alert if multiple regions and/or multiple customers experience latency above a defined threshold. Then our engineers can receive a notification allowing them to respond to a potential issue immediately. This is awesome!
Discovering The Underlying Issue

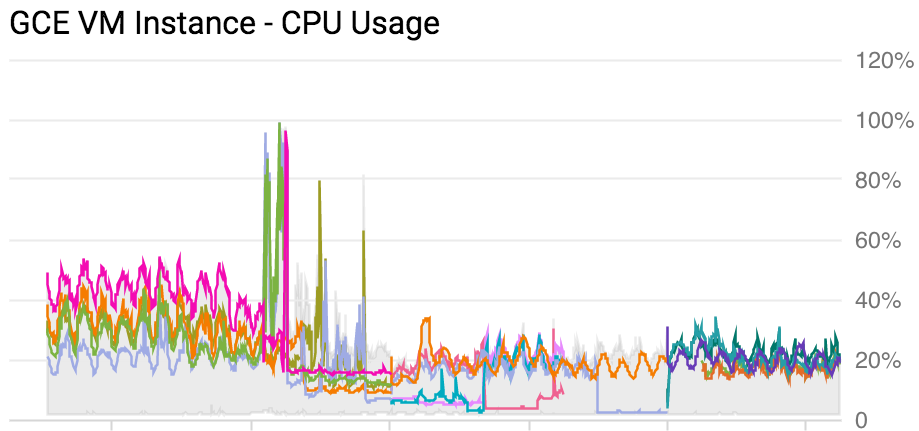
Our CPU alert exposed a large issue that, once resolved, improved our platform stability significantly. As you can see from the graph, we previously averaged usage of about 40% and then suddenly we have a spike hitting 100% CPU usage. Resource usage at 100% is not necessarily a bad thing. But what occurred was sustained usage which maxed out our allotted Kubernetes cluster resources. This graph is what gave us insight into otherwise just observing the effects of increased response latency.
Gaining Insight
Insight is definitely the best way to describe how metrics and monitoring can help your products or services. Do not expect answers; instead, judge your graphs on how well they point you in the direction of a solution. In this case we were able to quickly identify the service consuming most of our CPU resource and dig into the code to optimize it’s usage.
After the 100% spike where things go all over the place, that is us developing a solution. Then at the tail end we’ve solved it and reduced our usage by half.
Stackdriver can be used independently of Google Cloud, but there are quite a few benefits of combining the two, especially with Google App Engine. Everything I’ve shown so far is data that came from our Kubernetes cluster in GCP. There is a lot of work to set that up, maintain, and build on it. This is where App Engine shows its value, it's essentially Kubernetes as a service. Our team doesn’t have to deal with the details of how software gets put into the network and scaled. They simply define a container (a Dockerfile), setup an app.yaml file, and then they release application code. What this means is our container orchestration plumbing, service resource scaling, and networking is done for us. Along with all of this, App Engine is managing your Kubernetes cluster for you so they can make exposing your cluster and container data and logs dead simple, making the process of what I’ve shown instant on day one. Seriously! The second your running your platform in App Engine you have all this data available.
These value props from App Engine are so strong that at Zesty.io we are committed to running our complete platform within App Engine, even though this equates to increased monthly costs for us. We believe it will result in reduced organizational costs over the long term.
Fast App Development
Now that our three primary concerns of hardware upgrades, updating/patching of servers & software, and monitoring to understand how outages are handled, what is left? Solving problems for your customers!
By solving these, an amazing thing happens. Your engineers can have confidence in their deploys. When they have confidence in their deploys, they can iterate faster. When you are focusing on product and iterating faster, you allow your team to get closer to customers' concerns which creates a more customer-focused engineering culture. Plus, you can start doing some sophisticated things with your releases, such as tagged canary releases and rollbacks on alerts. i.e. Release code to a portion of your traffic and if your error count goes up, something is wrong, and you rollback to your previous working state. You can observe trends overtime to find resource hot points. You can discover weaknesses in your architecture.
Customer Service
We made the switch to GCP in 2016. It was great we received all of the already mentioned benefits, but this was just after Diane Greene joined Google to lead their cloud business. Let me tell you, GCP with Diane Greene is something special. The day we got a calendar invite from our newly assigned account manager, I knew we had made the right long-term choice. Anyone who has worked in enterprise knows the need to provide services for complex and high-value customers. This aspect has really set GCP apart.
Adding It All Up
The value of GCP for us is the integrated nature of their products and how that gives rise to the feeling they are aligned with what we are trying to accomplish: building web-based services. Web-based services are naturally going to require specific resources. For example, servers, caches, databases, queues, CDNs, networking, and a lot more. But, instead of just giving you these raw resources and leaving it up to you to connect, manage and maintain them, they do all of this for you as well as send all the logs and metrics that are generated into Stackdriver on day one. So you can have the monitoring you need to be confident your platform is healthy. This saves us a large amount of time (we are talking months) not needing to build these solutions ourselves.
What I’ve covered is just a small look into our continuing journey of improving our platform infrastructure, getting deeper insights from our metrics, and providing a stable and scalable platform to increase value for our customers.
X
By Stuart Runyan
Developing web technologies is my passion! I'm focused on creating applications and experiences to solve the problems which today's digital marketers face. I believe in web standards, a mobile first approach, access for everyone, open source software and the democratization of information. My goal is to continue the Internet being pure awesome!