Usage Reports
This documentation provides an in-depth guide to understanding and utilizing the Usage Reports feature within Zesty.io. It is designed to help users effectively track and analyze their website's resource consumption, including bandwidth usage and types of resource requests.
Getting Started
#Accessing Usage Reports
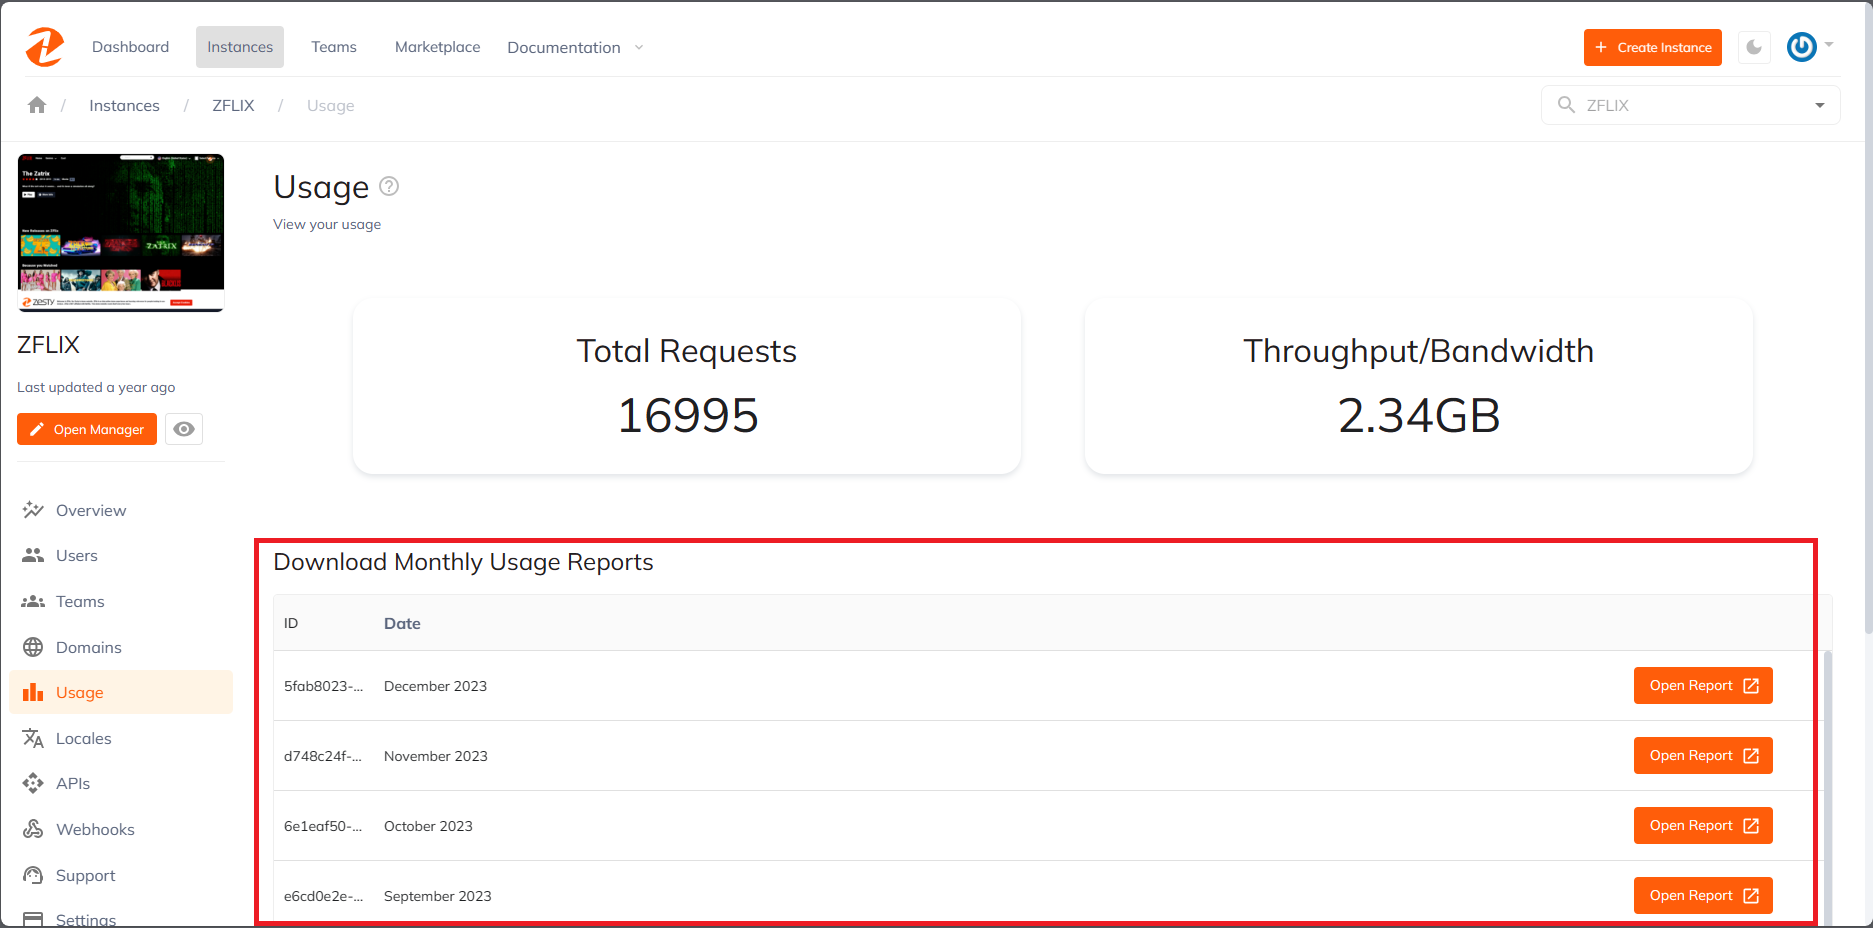
#There are two ways to access the Usage Reports in Zesty, one in the Instance Settings, and one in the Manager UI.
-
Instance Settings
-
Manager UI
Interface Overview
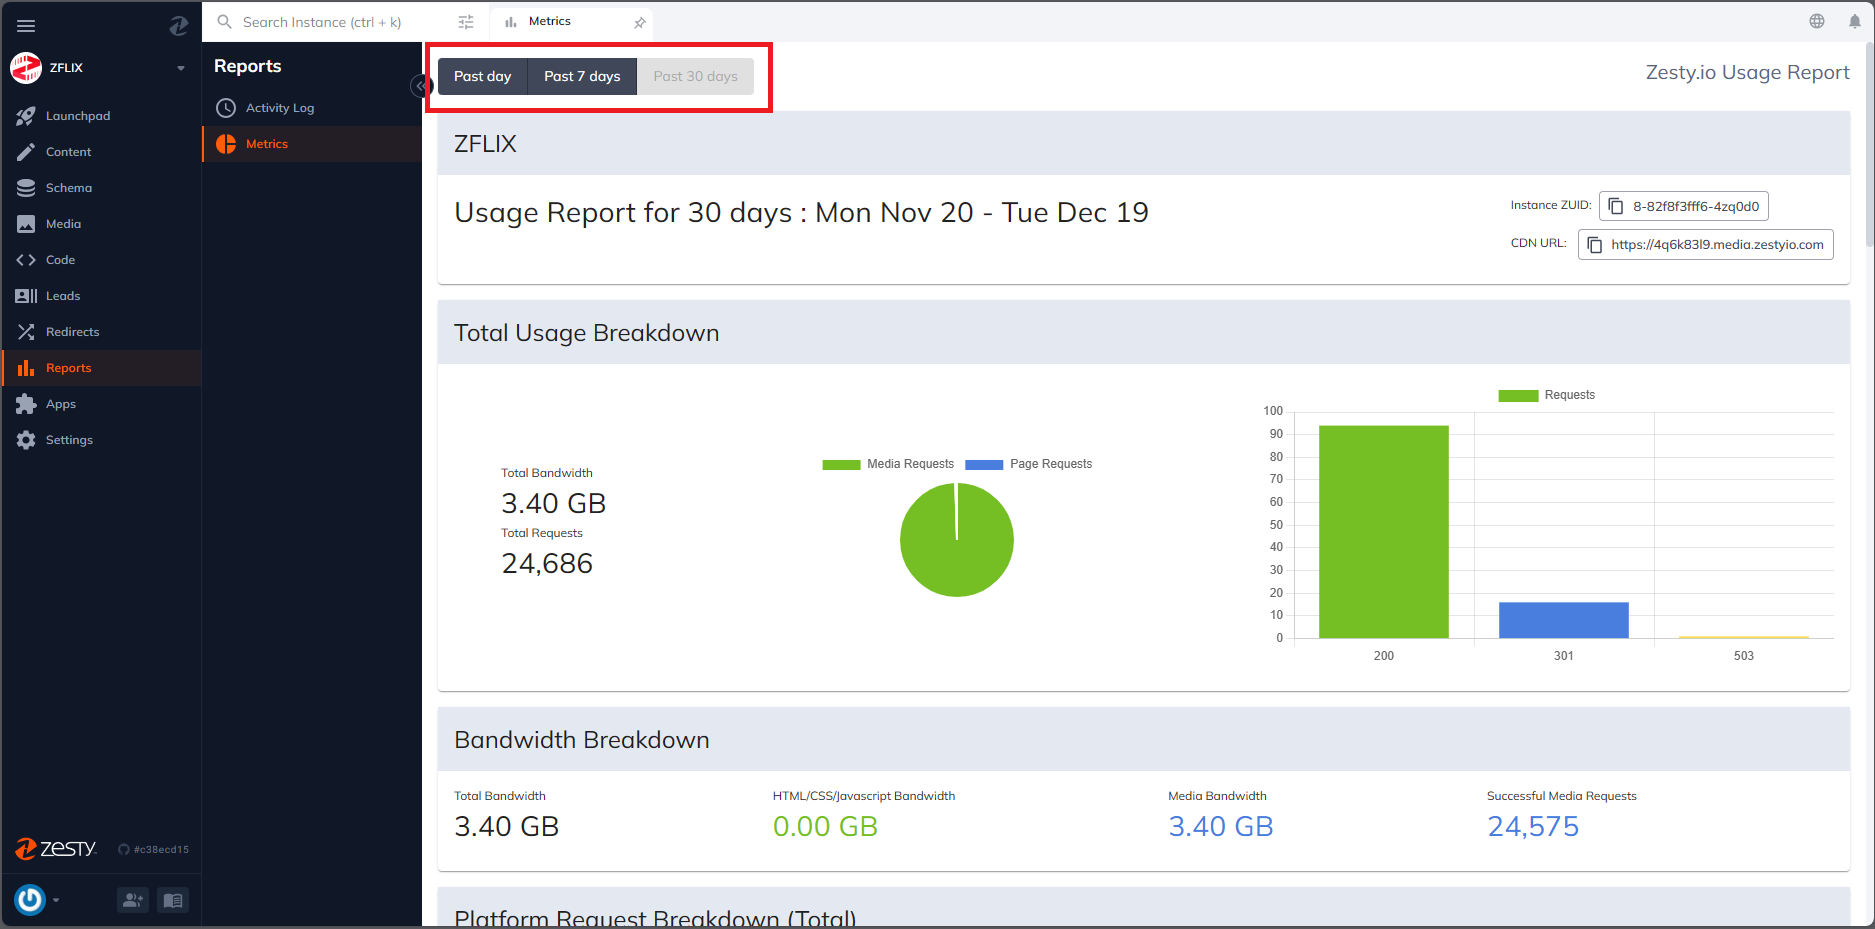
#The main difference between the Usage Reports in Instance Settings and Manager UI, is that in the Instance Settings, the reports are broken down every month while on the Manager UI it’s broken down in 1, 7, and 30 days.
-
Instance Settings
-
Manager UI
Understanding the Usage Reports
#Important Clarification
#Before diving into the metrics, it's crucial to understand that the Usage Reports in Zesty.io measure the total number of resource requests made to your website, not the overall website traffic. This distinction is important as resource requests focus on server interactions for specific files and elements, rather than the total number of visitors or page views.
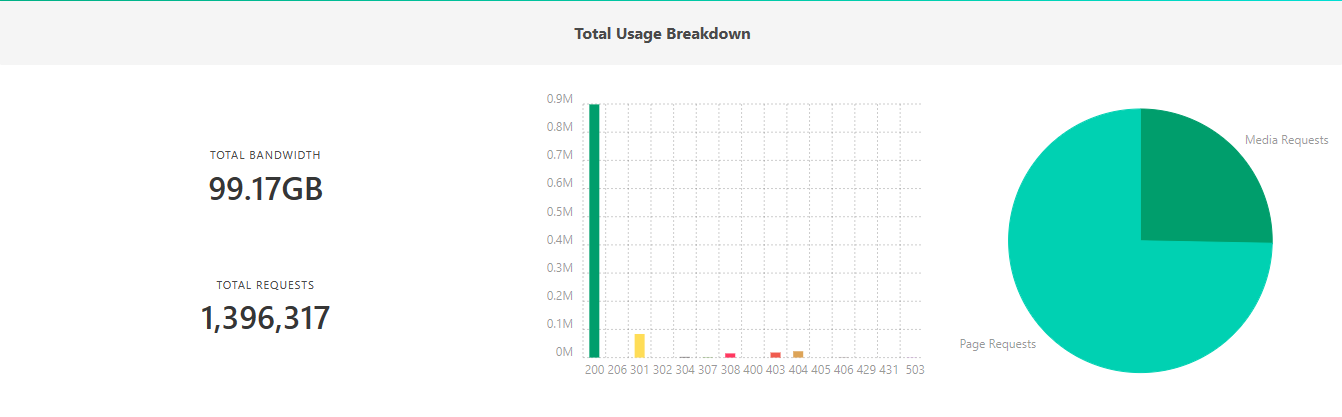
Total Usage Breakdown
#
-
Total Bandwidth
Bandwidth refers to the amount of data transferred from your website to the user's device. It is measured in gigabytes (GB) and is a crucial indicator of your website's traffic volume. High bandwidth usage can indicate heavy traffic or large file sizes being transferred.
-
Total Requests
A 'request' occurs each time a user's browser asks for a file from your server. This includes requests for HTML pages, CSS stylesheets, JavaScript files, and media content. Monitoring the total number of requests helps you understand the server load and user engagement with your site.
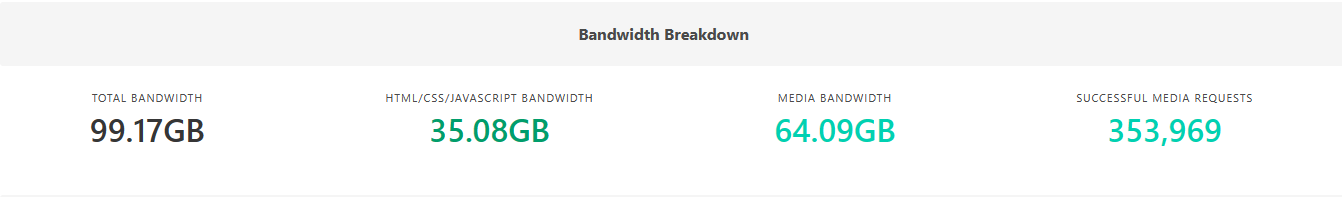
Bandwidth Breakdown
#
-
Total Bandwidth
Total Bandwidth represents the cumulative amount of data requested from the servers. This includes all types of content – from web pages to media files.
-
HTML/CSS/JS Bandwidth
This metric measures the bandwidth used by your website's structural elements – HTML, CSS, and JavaScript files and other files hosted on the instance domain. It's essential for understanding the load imposed by your site's core architecture and functionality.
-
Media Bandwidth
Media bandwidth encompasses data transferred for all media types, including images, videos, and PDFs. Since media files are typically larger, they often account for a significant portion of total bandwidth. Monitoring this helps in optimizing media content for better performance.
-
Successful Media Requests
This metric counts the number of successful requests for media files. A successful request occurs when a media file is successfully loaded and displayed to the user.
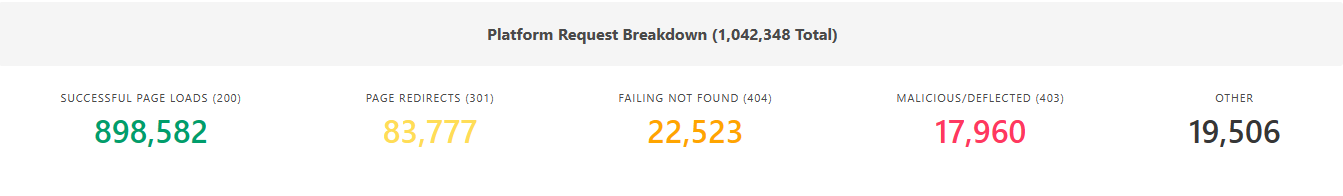
Platform Request Breakdown
#
-
200 Successful Page Loads
This indicates the number of times pages have been successfully loaded and viewed. A high count is a positive indicator of user engagement and website accessibility.
-
301 Redirects
Redirects occur when a requested URL is moved to a different location. While they are normal for website navigation, excessive redirects might suggest issues with site structure or outdated links.
-
404 Not Found
These are errors indicating that a requested resource could not be found. Frequent 404 errors can harm user experience and should be addressed by fixing broken or missing links.
-
403 Malicious/Deflected
A 403 error signifies a request that was identified as potentially malicious and was blocked. Monitoring these can help in enhancing your website's security.
-
Other Codes
Other less common response codes might appear, each indicating specific scenarios like server errors (500) or service unavailability (503).
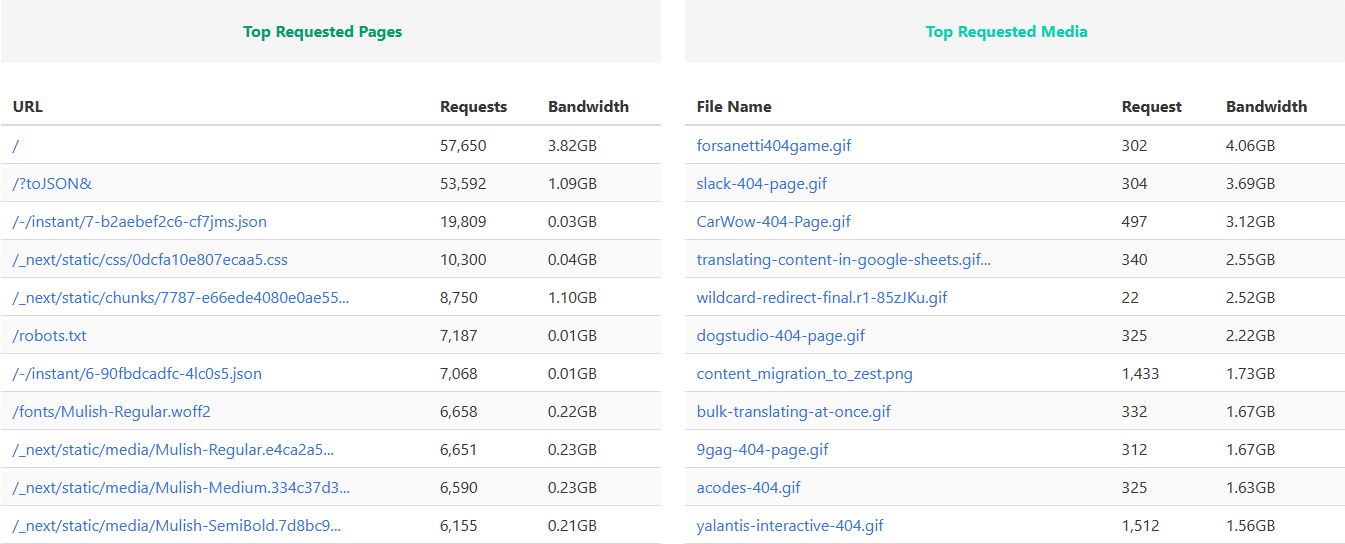
Top Requested Pages and Media
#
-
Analyzing Top Pages
This section lists the most requested pages (or files in HYBRID/HEADLESS mode) on your site. High-traffic pages are key indicators of user interest and engagement. Analyzing this data helps in understanding what content resonates with your audience.
-
Understanding Media Requests
Identify which media files are most requested. This insight is valuable for content strategy, indicating which types of media are most effective in engaging your audience.
Response Codes Overview
#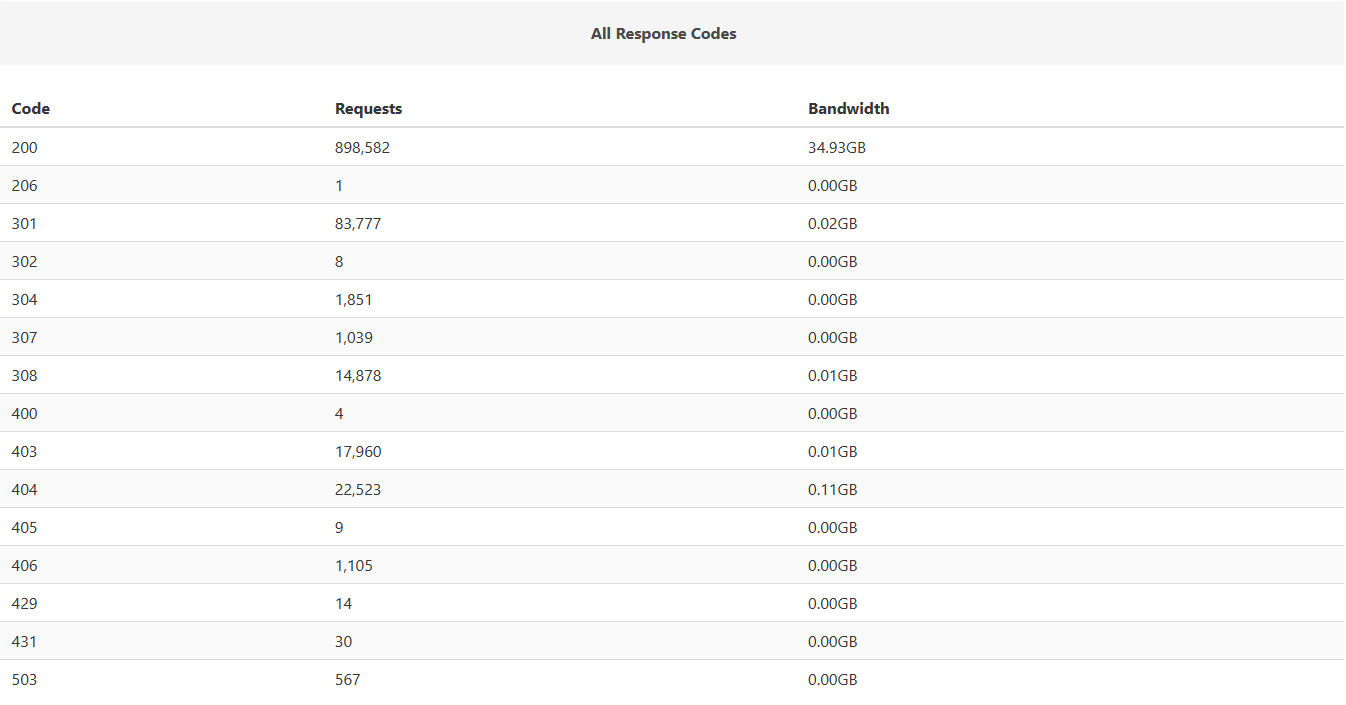
Each HTTP response code provides insight into how your website interacts with users and search engines. For instance:
200 OK: Successful response, the request has been fulfilled.
301 Moved Permanently: The requested resource has been permanently moved to a new URL.
404 Not Found: The server can't find the requested resource.
403 Forbidden: The request was legal, but the server is refusing to respond to it.
Connect with Content Experts
Book a free 15-minute consultation with a content expert. Discuss your application, pain points and requirements. Understand how Zesty's lower total cost of ownership, features, functionality can elevate your business by creating extraordinary digital experiences.
Trusted By


G2 MOMENTUM LEADER